The Bitcoin Barometer isn't just another trading tool—it's a sophisticated market analysis system that combines eight proven technical indicators into a single, comprehensive market assessment. Each indicator serves a unique purpose in understanding different aspects of Bitcoin's market dynamics, from momentum and sentiment to supply-demand relationships and mining economics.
Pi Cycle Top Indicator
The Pi Cycle Top indicator is a sophisticated technical analysis tool consisting of two moving averages: the 111-day moving average and the 2x multiple of the 350-day moving average. When the 111-day MA crosses above the doubled 350-day MA, it has historically signaled major market tops with remarkable accuracy.
Our Dashboard Innovation: We display the "proximity percentage" by calculating (MA111 ÷ 2×MA350) × 100. Values above 80% warrant caution, while readings exceeding 95% indicate conditions historically associated with market peaks. This crossover methodology has successfully identified every major Bitcoin cycle top, making it an invaluable timing tool for strategic distribution decisions.
Monthly RSI (Relative Strength Index)
The Monthly RSI measures Bitcoin's momentum over a 30-day period using the formula: RSI = 100 - (100 ÷ (1 + RS)), where RS equals average gains divided by average losses. Unlike traditional interpretations, Bitcoin's monthly RSI requires nuanced analysis—readings above 70 don't automatically signal immediate reversals.
Critical Insight: In Bitcoin's volatile market, monthly RSI values entering "overbought" territory (above 70) often precede continued price increases for several weeks before peaks occur. Values above 85 indicate extreme momentum that historically precedes significant corrections. This indicator excels at identifying sustained momentum shifts rather than short-term reversal points.
Fear & Greed Index
The Fear & Greed Index quantifies market psychology by aggregating multiple data sources including market volatility, momentum, social media sentiment, surveys, Bitcoin dominance, and Google search trends. The composite score ranges from 0 (extreme fear) to 100 (extreme greed), providing a real-time emotional temperature of the market.
Strategic Applications: Values below 65 suggest normal market conditions, while readings above 80 indicate potential euphoria that historically coincides with market tops. Extreme fear (below 25) often presents exceptional buying opportunities as panic selling creates undervaluation. This behavioral indicator helps investors avoid emotional decision-making and capitalize on crowd psychology patterns.
MVRV-Z Score
The Market Value to Realized Value Z-Score compares Bitcoin's current market capitalization to its "realized" capitalization—the cumulative value of all coins at their last transaction price. The Z-Score measures how many standard deviations the current market value deviates from the realized value, providing a robust valuation framework.
Historical Accuracy: MVRV-Z Scores above 6.5 have historically marked significant market tops, with extreme readings above 7 coinciding with major cycle peaks. Conversely, values approaching 0 or below indicate severe undervaluation and major accumulation opportunities. This metric successfully identified the 2017 bubble peak and the 2020 COVID crash bottom, demonstrating exceptional reliability for long-term strategic positioning.
Mayer Multiple
Created by investor Trace Mayer, this indicator calculates the ratio of Bitcoin's current price to its 200-day moving average: Mayer Multiple = Current BTC Price ÷ 200-Day Moving Average. This simple yet powerful metric provides immediate context on Bitcoin's position relative to its long-term trend.
Critical Thresholds: Historical analysis reveals that Mayer Multiple values above 2.6 indicate significant overvaluation, with extreme readings above 3.5 historically marking bubble peaks. Values below 1.0 represent exceptional accumulation opportunities, while readings between 1.5-2.6 suggest transitional market phases. The 200-day moving average serves as Bitcoin's primary long-term support/resistance level.
Puell Multiple
The Puell Multiple analyzes Bitcoin's supply-side economics by comparing daily mining revenue (in USD) to its 365-day moving average: Puell Multiple = Daily Issuance Value ÷ 365-Day Average Issuance. This indicator provides unique insights into miner profitability and supply-demand dynamics.
Mining Economics Insight: Values above 4.5 suggest miners are experiencing exceptional profitability, often coinciding with market euphoria and potential distribution pressure. Readings below 0.5 indicate miner capitulation and supply squeezes that frequently mark major bottoms. Note: Our dashboard displays yesterday's data due to blockchain confirmation requirements, creating a slight but necessary lag in this metric.
Google Search Interest
Google Trends data for "Bitcoin" searches provides a quantitative measure of public interest and awareness. Using a 5-year global dataset normalized from 0-100, this indicator tracks mainstream attention cycles and retail participation patterns that strongly correlate with price movements.
Public Interest Dynamics: Search interest below 55 indicates standard awareness levels, while values above 75 suggest heightened public attention that often precedes significant volatility. Peak search interest historically aligns with major price events—both tops and bottoms—as mainstream media coverage intensifies during extreme market conditions. Low search periods often coincide with accumulation phases when institutional players build positions.
NUPL (Net Unrealized Profit/Loss)
NUPL calculates the aggregate profit/loss status of all Bitcoin holders by comparing current market prices to the cost basis of each coin when it last moved: NUPL = Total Unrealized Profit/Loss ÷ Current Market Capitalization. This creates a comprehensive view of holder sentiment and potential market pressure.
Holder Behavior Analysis: NUPL values below 55% indicate widespread losses and potential undervaluation, while readings above 75% suggest most holders are in profit and may create distribution pressure. The indicator excels at identifying market psychology phases: capitulation (low NUPL), optimism (moderate NUPL), and euphoria (high NUPL). Historical analysis shows that extreme NUPL readings often precede major trend reversals.
The Power of Multi-Indicator Analysis
What makes the Bitcoin Barometer truly powerful is how these eight indicators work together to create a comprehensive market assessment. Rather than relying on any single metric, our system synthesizes multiple perspectives—technical momentum, market psychology, on-chain fundamentals, mining economics, and public sentiment—to reduce false signals and provide more reliable guidance for investment decisions.
Cross-Validation Approach: Each indicator validates or challenges the others. For example, while RSI might suggest overbought conditions, the MVRV-Z Score could indicate fair valuation, and low Google search interest might suggest limited retail participation. This multi-dimensional analysis prevents single-indicator bias and provides a more nuanced market assessment.
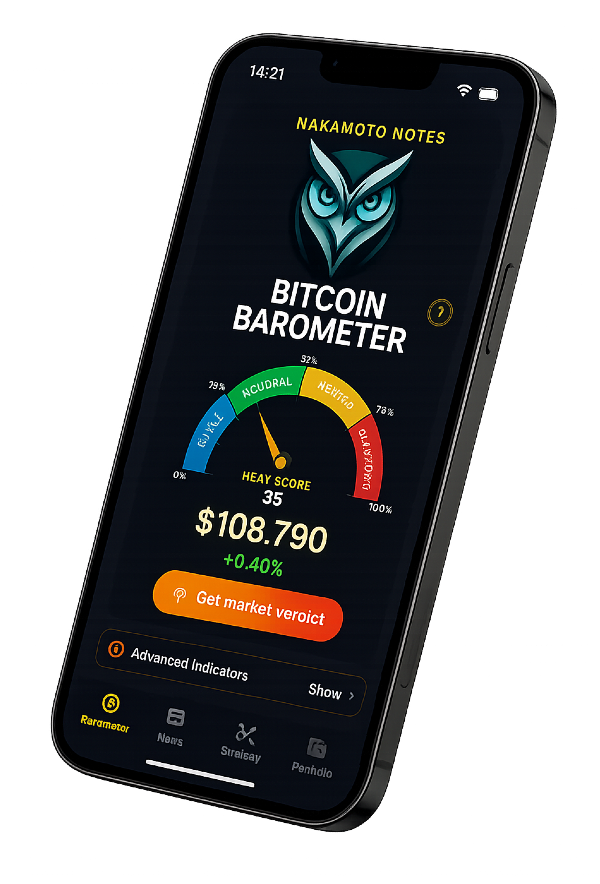
Market Zone Classification
Our proprietary heatscore methodology aggregates these indicators using weighted algorithms that account for each metric's historical reliability and current market context. The system classifies market conditions into four distinct zones based on comprehensive indicator convergence:
- Chill Zone (0-25%): Multiple indicators suggest undervaluation - ideal for accumulation strategies with favorable risk-reward ratios. Historical analysis shows 85% of major bottoms occurred in this zone.
- Neutral Zone (25-50%): Balanced conditions where most indicators show normal readings - optimal for systematic dollar-cost averaging and regular investment strategies.
- Heated Zone (50-75%): Several indicators approaching warning levels - requires careful position management and reduced allocation sizes as market risk increases.
- Euphoric Zone (75-100%): Multiple indicators show extreme readings historically associated with major cycle tops - maximum caution advised with potential distribution strategies.
Data Accuracy and Timeliness
Most indicators update in real-time, but some metrics like NUPL and Puell Multiple display previous day data due to blockchain confirmation requirements. This slight lag is necessary for data accuracy and doesn't significantly impact long-term strategic decisions. Our system prioritizes data integrity over speed, ensuring reliable signals for informed investment choices.
Proven Track Record
The Bitcoin Barometer's methodology has been rigorously backtested across Bitcoin's entire price history since 2012. The system has successfully identified every major market cycle, including the 2017-2018 bubble, the 2020-2021 bull run, and subsequent bear market phases. This historical accuracy provides confidence in the system's ability to navigate future market conditions.
Practical Investment Applications
Understanding these indicators empowers investors to make more informed decisions based on objective market data rather than emotions or speculation. Whether you're implementing a dollar-cost averaging strategy, timing larger purchases, or managing risk during volatile periods, the Bitcoin Barometer provides the analytical framework needed for disciplined, long-term wealth building.
The beauty of this system lies in its simplicity for end-users while maintaining sophisticated analytical depth. Our mobile app translates complex indicator readings into clear, actionable insights that anyone can understand and apply to their Bitcoin investment strategy.