What is the Fear and Greed Index?
The Fear and Greed Index is a popular market sentiment indicator used to gauge the emotions driving the cryptocurrency market, particularly Bitcoin. Developed to assess the psychological state of investors, this index ranges from 0 to 100, where values closer to 0 indicate extreme fear and values closer to 100 indicate extreme greed. Understanding this index is crucial for investors as it provides insights into market behaviors, which can be pivotal in making informed investment decisions.
How Does It Work?
The Fear and Greed Index takes into account various factors that reflect market sentiment, including:
- Market Volatility: Measures fluctuations in Bitcoin’s price.
- Market Momentum: Analyzes the trading volume and price momentum.
- Social Media Activity: Assesses the level of discussions and mentions on platforms like Twitter.
- Surveys: Engages the community to gather sentiment data directly from investors.
- Trends: Looks at Google Trends data for Bitcoin-related searches.
By synthesizing these data points, the index provides a quick snapshot of market sentiment, helping investors understand whether the market is overly optimistic or pessimistic.
Current Reading and Market Interpretation
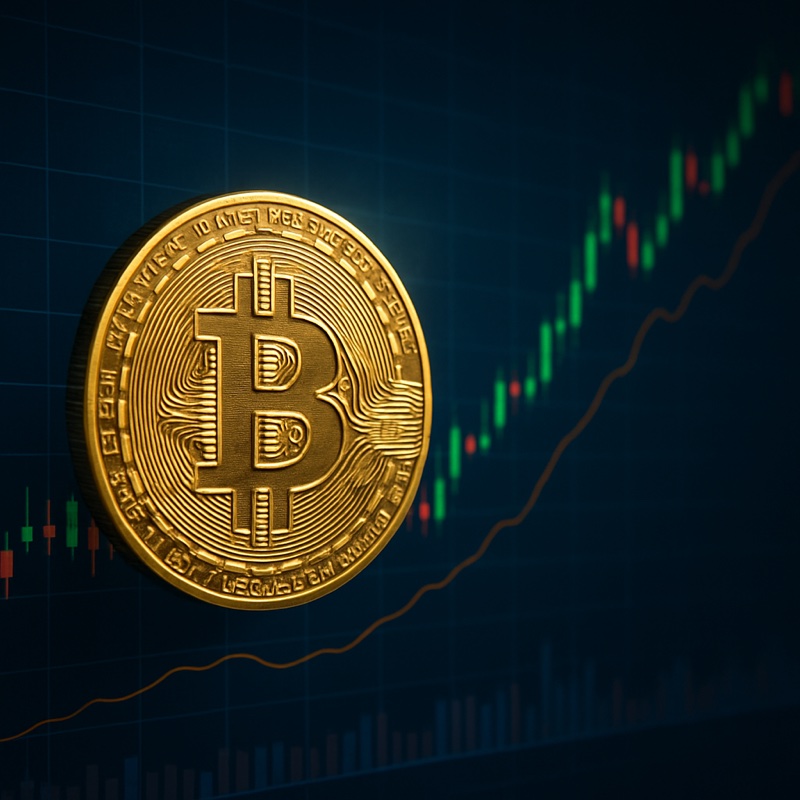
As of now, the Fear and Greed Index stands at 10, indicating a state of Extreme Fear in the market. This reading falls within the Chill Zone, suggesting that many investors are anxious about the current market conditions.
The current price of Bitcoin is $93,427.00, which reflects a 24-hour change of -2.22%. This decline, coupled with the extreme fear sentiment, often signals potential buying opportunities for savvy investors. When fear dominates the market, it can lead to undervaluation of assets, creating a favorable environment for long-term investments.
Historical Context and Significance
Historically, the Fear and Greed Index has proven to be a reliable indicator of market trends. For instance:
- In March 2020, during the onset of the COVID-19 pandemic, the index dropped to extreme fear levels, coinciding with Bitcoin prices reaching low points. This situation provided a unique buying opportunity for investors who recognized the market’s overreaction.
- Conversely, in December 2017, the index soared to extreme greed levels, aligning with Bitcoin’s all-time high at the time. This period was characterized by rampant speculation, leading to a subsequent market correction.
These examples illustrate that extreme fear can often precede price recoveries, while extreme greed may foreshadow market corrections. Understanding these patterns can help investors make more strategic decisions.
What This Means for Bitcoin Investors
For Bitcoin investors, the current extreme fear reading presents both challenges and opportunities. Here are some actionable insights:
- Consider Buying on Dips: Extreme fear can signal a buying opportunity. Investors who believe in Bitcoin’s long-term potential might consider accumulating during this period.
- Stay Informed: Monitor the Fear and Greed Index regularly. Changes in sentiment can happen quickly, and being aware of these shifts can help you make timely decisions.
- Diversify Your Portfolio: While Bitcoin remains a leading cryptocurrency, diversifying into other assets can help mitigate risks associated with extreme market sentiment.
- Set Clear Goals: Define your investment strategy based on risk tolerance. In fear-driven markets, it’s crucial to stick to your long-term goals and avoid impulsive decisions fueled by emotions.
As always, it is important to conduct thorough research and consider market conditions before making investment decisions.
Key Takeaways
The Fear and Greed Index is a vital tool for Bitcoin investors, providing insights into market sentiment that can inform investment strategies. With the current reading of 10, indicating Extreme Fear, investors may find unique opportunities to buy at lower prices. Historical patterns suggest that extreme fear can lead to market recoveries, making it essential for investors to remain calm and strategic in their approach.
For the latest updates and insights, be sure to visit nakamotonotes.com, your go-to source for cryptocurrency data and analysis.