What is the Pi Cycle Top Indicator?
The Pi Cycle Top Indicator is a powerful tool used by traders and investors to identify potential tops in the Bitcoin market cycle. This indicator is based on two moving averages: the 111-day moving average and the 350-day moving average, adjusted for the price of Bitcoin. When these two averages cross, it typically signifies a peak in Bitcoin's price trend, often leading to a significant correction or bear market.
The significance of this indicator lies in its historical accuracy. It has successfully predicted major market tops in previous Bitcoin cycles, making it a valuable resource for those looking to navigate the volatile cryptocurrency landscape.
How Does It Work?
The Pi Cycle Top Indicator operates on the principle of moving averages, which smooth out price data to identify trends over a specified period. Specifically, it utilizes:
- 111-day Moving Average: This average gives a short-term perspective on Bitcoin's price trends.
- 350-day Moving Average: This average offers a long-term view, helping to identify overarching market cycles.
When the 111-day moving average crosses above the 350-day moving average, it is considered a warning sign that a price top may be forming. Conversely, if the 350-day moving average rises above the 111-day average, it typically indicates that a bullish trend is still intact.
Current Reading and Market Interpretation
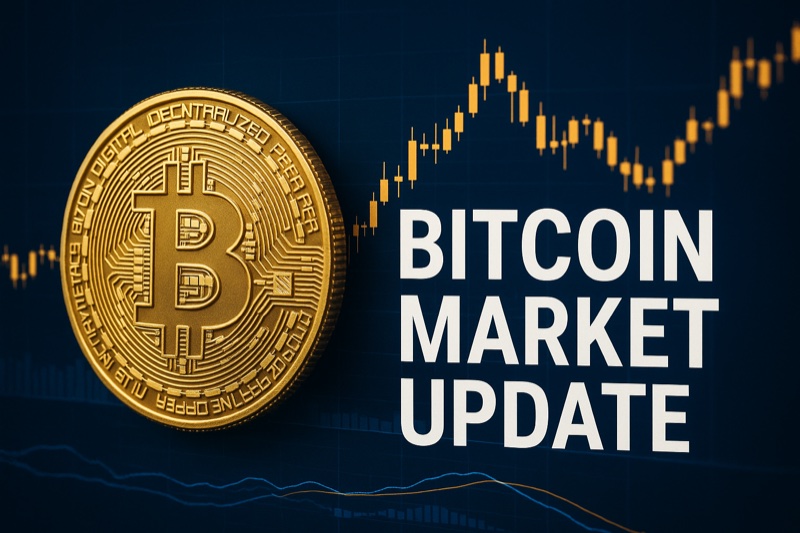
As of now, the Pi Cycle Top Indicator stands at 58.61, while Bitcoin's price is approximately $109,101.00. The current market zone is classified as a Neutral Zone, and the Fear and Greed index also reflects a neutral sentiment.
The reading of 58.61 is noteworthy as it suggests that we are approaching the higher end of the indicator's range. However, since it is not yet at the historical highs seen in previous cycles, it indicates that the market may still have room for growth before hitting a definitive top. The recent 24-hour change of +0.46% shows a slight upward trend, adding to the complexity of the current market sentiment.
Historical Context and Significance
To fully appreciate the significance of the Pi Cycle Top Indicator, it is essential to look at its historical performance. The indicator has accurately predicted price tops in several key instances:
- In December 2017, the indicator indicated a peak shortly before Bitcoin's price plummeted from nearly $20,000 to around $3,000.
- In April 2021, the indicator again signaled a top as Bitcoin reached its all-time high of approximately $64,000 before experiencing a substantial correction.
These instances demonstrate how the Pi Cycle Top Indicator can serve as a crucial tool for investors looking to make informed decisions based on historical patterns and market signals. By understanding past trends, investors can better prepare for future market movements.
What This Means for Bitcoin Investors
For Bitcoin investors, the current reading of the Pi Cycle Top Indicator serves as both a cautionary sign and an opportunity. Here are some actionable insights based on the current market conditions:
- Monitor Market Trends: Keep an eye on the movement of the 111-day and 350-day moving averages. A crossover could signal a potential market shift.
- Diversify Investments: Given the neutral sentiment in the market, consider diversifying your portfolio to mitigate risks associated with potential downturns.
- Stay Updated: Regularly check resources like nakamotonotes.com for the latest data and insights on the Pi Cycle Top Indicator and other Bitcoin metrics.
- Set Stop-Loss Orders: If you are currently holding Bitcoin, consider setting stop-loss orders to protect against unexpected market movements.
Key Takeaways
The Pi Cycle Top Indicator is a vital tool for Bitcoin traders and investors, providing valuable insights into potential market tops and trends. With the current reading at 58.61, it indicates that while we are in a neutral market zone, caution is advised as we approach historical highs.
By understanding how this indicator works and its historical significance, investors can make more informed decisions in their trading strategies. Remember to continuously monitor market trends and stay informed through reliable sources like nakamotonotes.com to navigate the complexities of Bitcoin investing effectively.