
NakamotoNotes provides data and education, not financial advice. Bitcoin is volatile; you can lose money. Do your own research.
Track the Mayer Multiple and seven other Bitcoin indicators daily in the NakamotoNotes app.
The Mayer Multiple is one of the most referenced metrics in Bitcoin market analysis. It was created by early Bitcoin investor Trace Mayer and answers a straightforward question: where is Bitcoin's price relative to its longer-term trend?
What the Mayer Multiple Measures
The Mayer Multiple divides Bitcoin's current price by its 200-day simple moving average (200 DMA).
Formula: Mayer Multiple = Current Bitcoin Price ÷ 200-Day Moving Average
The 200-day moving average averages Bitcoin's closing price across the past 200 trading days. It strips out short-term volatility to produce a slower-moving baseline — a picture of where price has been over roughly the past eight months.
A Mayer Multiple of 1.0 means Bitcoin is trading at exactly its 200-day average. Above 1.0, price is above that baseline. Below 1.0, price has declined beneath it.
What Historical Readings Have Looked Like
Since Bitcoin began trading in 2011, the Mayer Multiple has moved within a wide range. A few observed patterns stand out:
Below 1.0 — Price trading below its 200-day average. This has occurred during extended bear markets and sharp corrections. In December 2018, when Bitcoin fell to $3,200, the Mayer Multiple reached approximately 0.5. The March 2020 COVID crash pushed it to around 0.7.
1.0 to 1.5 — Price near or moderately above the moving average. The majority of Bitcoin's trading days historically fall within this range.
1.5 to 2.4 — Price significantly above the 200-day average. This range has appeared during late bull-market momentum phases.
Above 2.4 — Price far above its moving average. This range has historically been rare. The December 2017 cycle peak registered a Mayer Multiple near 3.7; the November 2021 peak reached approximately 3.2.
These are descriptive observations from Bitcoin's past. Historical distributions describe what has occurred — they do not predict what future readings will be.
What the Mayer Multiple Does Not Capture
The Mayer Multiple is a single-variable indicator. It only compares current price to one moving average. It does not measure network activity, miner economics, holder behavior, or broader market structure. Because it is based on a 200-day average, it responds slowly to recent price action and is not designed for short-term observations.
Reading the Mayer Multiple in isolation leaves out the majority of available Bitcoin market data.
How NakamotoNotes Tracks the Mayer Multiple
NakamotoNotes incorporates the Mayer Multiple as one of eight components in the Bitcoin Barometer — a composite score updated daily from 0 to 100.
The Barometer blends:
- Mayer Multiple
- MVRV Z-Score
- NUPL (Net Unrealized Profit/Loss)
- Fear & Greed Index
- Puell Multiple
- Monthly RSI
- Pi Cycle Top Indicator
- Google Search Trends
Each component contributes equally to the composite. When the Mayer Multiple sits in a historically low percentile, it reduces the Barometer score; a historically high percentile raises it. Combining eight independent data streams reduces the noise and false signals that any single indicator can produce.
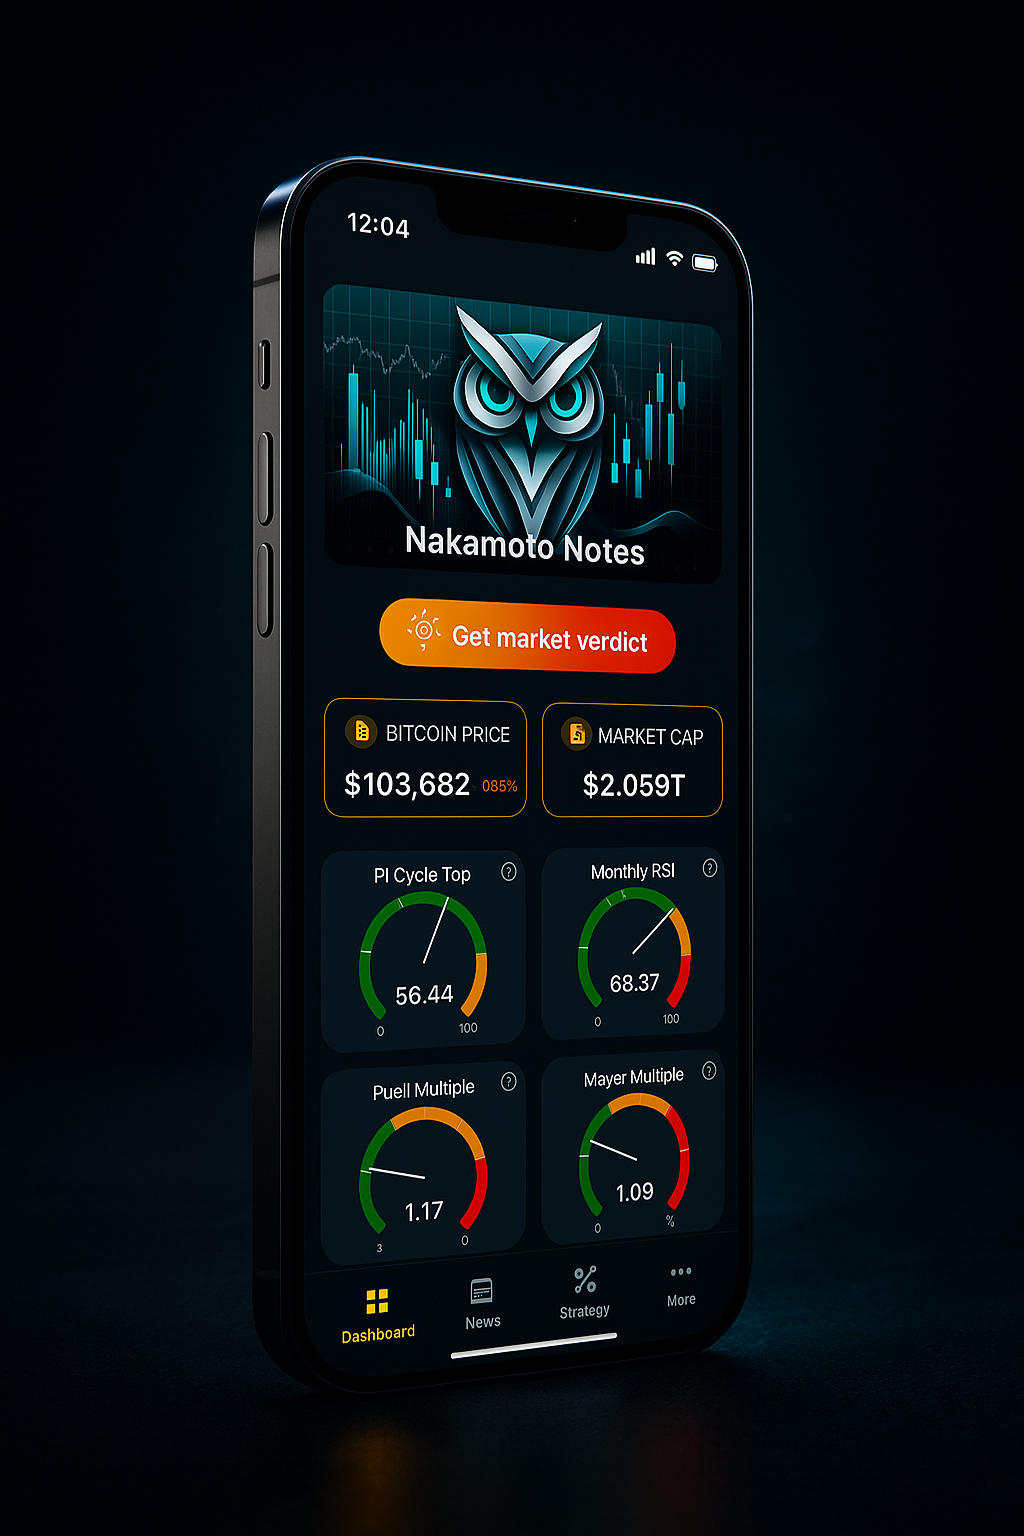
The app displays the current Mayer Multiple value alongside the seven other components and the composite Barometer score — updated every day.
Current reading (May 18, 2026): Bitcoin Barometer at 21/100 — CHILL zone. Bitcoin price: $77,496.
Open the app to see the current Mayer Multiple and the complete Barometer breakdown.
NakamotoNotes provides data and education, not financial advice. Bitcoin is volatile; you can lose money. Do your own research.