
NakamotoNotes provides data and education, not financial advice. Bitcoin is volatile; you can lose money. Do your own research.
NakamotoNotes tracks eight Bitcoin on-chain indicators in one daily score — updated every day, available on iOS and Android.
If you've spent time researching Bitcoin indicators, you've probably run into a familiar problem: the data is spread across a dozen different websites, updated at different times, expressed in different formats, and requires significant background knowledge to interpret.
The Mayer Multiple is on one site. MVRV Z-Score is on another. NUPL requires knowing what "realized cap" means. The Puell Multiple needs explanation before it means anything. The Fear & Greed Index is everywhere but tells you about price momentum more than cycle position.
Most people either give up and go back to watching the price, or they follow one indicator and treat it as more definitive than it is.
A good Bitcoin indicator app solves this by doing the aggregation for you — pulling in multiple data sources, normalizing them to a common scale, and presenting the composite picture in a way that requires no prior expertise to read.
What Makes a Bitcoin Indicator App Useful
The best Bitcoin indicator apps share a few characteristics:
Multi-indicator composites. A single indicator is useful context. A composite of 6-8 independent indicators, all pointing in the same direction, is a stronger signal. When the Mayer Multiple, MVRV Z-Score, NUPL, and Puell Multiple are all in historically low ranges simultaneously, that's more meaningful than any one of them in isolation.
Daily updates. On-chain data changes daily as new blocks are mined and Bitcoin moves between wallets. Weekly or monthly snapshots miss the nuance of where conditions are trending.
Historical context, not just current readings. A Mayer Multiple of 0.9 is only meaningful if you know that readings below 1.0 have historically been rare and have tended to precede recoveries. Raw numbers without percentile context are difficult to interpret.
No noise, no trading signals. The goal of tracking on-chain indicators is to understand market cycle position — not to get buy/sell alerts every hour. Apps that constantly push "URGENT: indicator crossed threshold" are optimizing for engagement, not for helping you make better long-term decisions.
The Eight Indicators Worth Tracking
For most Bitcoin investors, these eight indicators cover the meaningful on-chain picture:
- Mayer Multiple — price ÷ 200-day moving average. Below 1.0 has historically been an accumulation zone.
- MVRV Z-Score — market cap vs realized cap, normalized. Negative values have historically marked bear market bottoms; very high values have marked cycle peaks.
- NUPL (Net Unrealized Profit/Loss) — aggregate unrealized profit across all Bitcoin. Capitulation (negative) has historically preceded recovery; Euphoria has preceded corrections.
- Puell Multiple — daily miner revenue vs 365-day average. Low values historically coincide with bear market lows; high values with cycle tops.
- Monthly RSI — Relative Strength Index on the monthly timeframe. Below 40 has historically marked major buying opportunities; above 80 has marked tops.
- Pi Cycle Top Indicator — tracks crossing between two specific moving averages. Has historically signaled cycle peaks within days when the crossing occurs.
- Fear & Greed Index — market sentiment composite. Extreme Fear has historically been a buying signal; Extreme Greed has sometimes preceded corrections.
- Google Search Trends — public search interest in "Bitcoin." Peak interest has historically accompanied price peaks; trough interest has coincided with bear market lows.
No single indicator on this list is reliable enough to use in isolation. Used together, they provide a more complete picture of where Bitcoin sits in its market cycle.
How NakamotoNotes Tracks These Indicators
NakamotoNotes combines all eight indicators above into a single composite score — the Bitcoin Barometer — updated daily, on a scale of 0 to 100.
Each indicator contributes equally to the score. The Barometer reflects where the aggregate of all eight sits in historical context:
- 0–40 (CHILL): On-chain indicators are in historically calm, non-extended ranges. Multiple indicators simultaneously in historically favorable accumulation zones.
- 40–60 (WARM): Mid-range reading. No strong on-chain signal in either direction.
- 60–80 (HOT): Indicators are elevated. Market heating up by historical standards.
- 80–100 (FIRE): Multiple indicators simultaneously in historical danger zones. Conditions that have historically preceded major corrections.
Current reading (May 22, 2026): Bitcoin Barometer at 21/100 — CHILL zone. Bitcoin price: $77,369. Eight independent indicators are simultaneously in historically calm ranges.
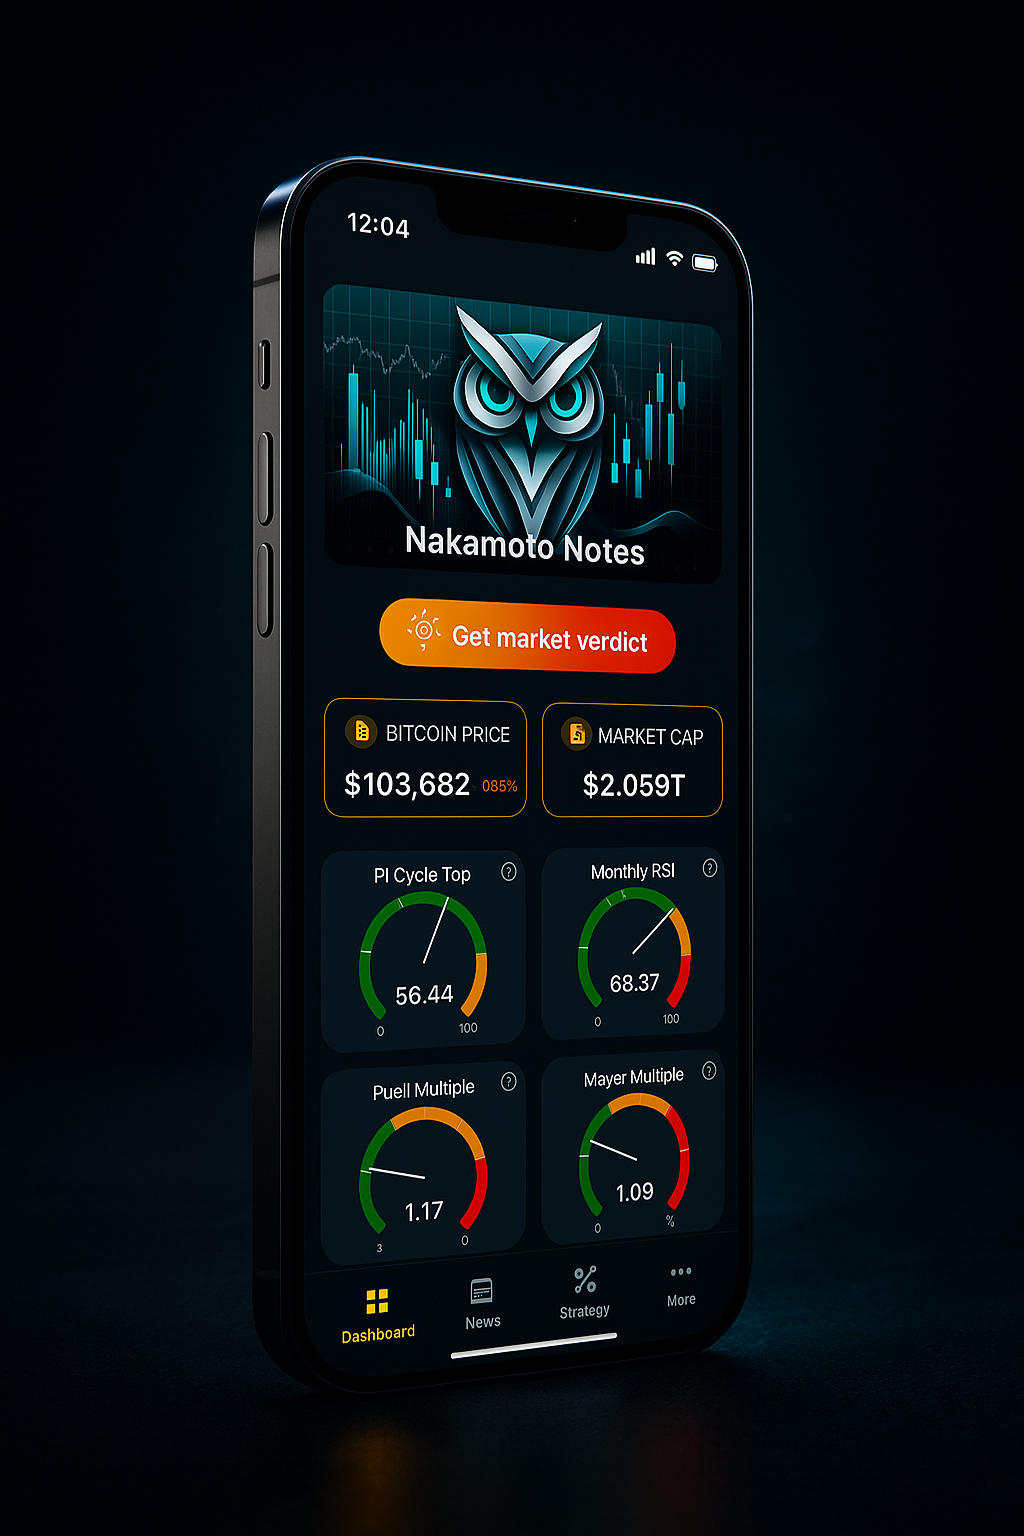
What NakamotoNotes Does Not Do
A few things worth being clear about:
- No price predictions. The Barometer shows where Bitcoin sits historically — not where it's going. Historical patterns are not guarantees.
- No trading signals. NakamotoNotes is not a trading app. It's a market cycle tracker for long-horizon investors.
- No financial advice. The data is educational context. What you do with it is your decision.
The goal is to replace emotion with data — to give you an objective framework so that a 15% price drop doesn't feel like a crisis if the on-chain data says the market is historically calm.
Download NakamotoNotes to track the Bitcoin Barometer and all eight indicators — updated daily.
NakamotoNotes provides data and education, not financial advice. Bitcoin is volatile; you can lose money. Do your own research.
