
NakamotoNotes provides data and education, not financial advice. Bitcoin is volatile; you can lose money. Do your own research.
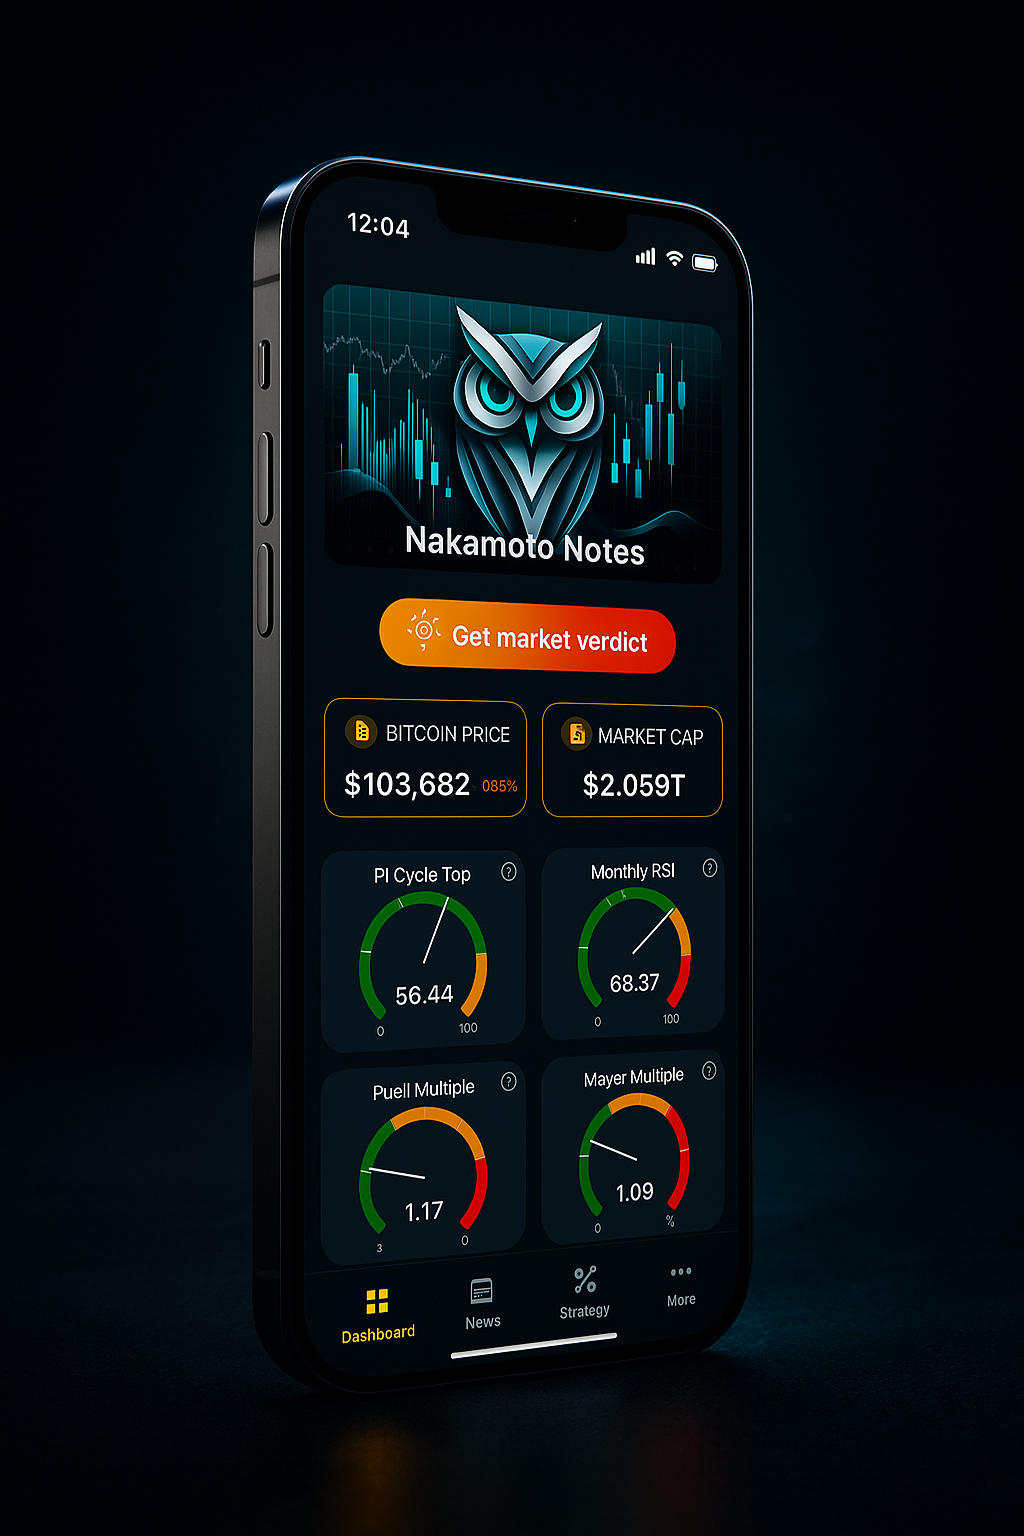
Track the Bitcoin Barometer and eight on-chain indicators — including real-time CHILL zone detection — in the NakamotoNotes app.
In Bitcoin market analysis, an accumulation zone is a price range where data suggests long-term holders are adding to their positions while short-term market sentiment remains low. These zones do not predict future price movements — they describe a measurable set of on-chain and market conditions that have historically coincided with low-sentiment periods in Bitcoin's market cycle.
What Defines a Bitcoin Accumulation Zone
An accumulation zone is not a precise price level. It is a confluence of market signals that indicate the following conditions are present simultaneously:
- Bitcoin is trading below or near its longer-term price averages
- Retail sentiment indicators are registering fear or low interest
- On-chain data shows net unrealized losses or low profitability across holders
- Miner economics are under pressure, suggesting capital rotation
None of these conditions alone defines an accumulation zone. Their simultaneous presence — measured across multiple independent indicators — is what market analysts use to characterize these periods.
The Mayer Multiple and Accumulation Zones
One of the most widely tracked indicators for identifying accumulation zones is the Mayer Multiple. It divides Bitcoin's current price by its 200-day simple moving average (200 DMA).
Formula: Mayer Multiple = Current Bitcoin Price ÷ 200-Day Moving Average
When the Mayer Multiple falls below 1.0, Bitcoin is trading beneath its 200-day average — a condition that has historically appeared during extended bear markets and sharp corrections. In December 2018, the Mayer Multiple reached approximately 0.5. During the COVID crash in March 2020, it fell to around 0.7. In each of these periods, what followed was a significant price recovery — though past patterns do not guarantee future outcomes.
A Mayer Multiple below 1.0 does not signal that a recovery is coming. It signals that price is extended to the downside relative to its own moving average — a descriptive data point, not a prescription to act.
How the NakamotoNotes Barometer Identifies Accumulation Zones
NakamotoNotes tracks accumulation zone conditions through the Bitcoin Barometer — a composite score from 0 to 100 that blends eight independent market and on-chain indicators updated daily:
- Mayer Multiple
- MVRV Z-Score
- NUPL (Net Unrealized Profit/Loss)
- Fear & Greed Index
- Puell Multiple
- Monthly RSI
- Pi Cycle Top Indicator
- Google Search Trends
When multiple indicators cluster at historically low readings, the Barometer enters what NakamotoNotes calls the CHILL zone — a Barometer score below 50. When the score falls below 25, the reading is classified as Extreme CHILL.
CHILL zone readings have historically coincided with the accumulation zone conditions described above. The composite approach reduces false signals: any single indicator can spike or dip for unrelated reasons, but when eight independent data sources align at historically low levels, the signal carries more weight.
Historical CHILL Zone Periods
Past CHILL zone readings have appeared at some of the most widely discussed low-sentiment periods in Bitcoin's history. These are descriptive observations — historical patterns do not repeat in identical form.
- March 2020 (COVID crash): Barometer near 8/100. Mayer Multiple fell to approximately 0.7.
- June 2022 (bear market low): Barometer near 12/100. Mayer Multiple reached approximately 0.5.
- October 2023 (pre-ETF period): Barometer near 19/100. Mayer Multiple around 0.88.
In each case, the cluster of indicators — not just the Mayer Multiple alone — produced a CHILL zone reading. The Barometer's composite approach is what distinguishes these readings from single-indicator noise.
What Accumulation Zone Data Does Not Tell You
The data describes market conditions. It does not prescribe action. An accumulation zone reading tells you that multiple indicators are historically low — it does not tell you when or whether prices will recover, how long the zone will persist, or what any individual investor should do.
Bitcoin has entered CHILL zones and continued lower before recovering. It has also reversed quickly from CHILL readings. The data does not predict which outcome follows.
Current reading (May 23, 2026): Bitcoin Barometer at 21/100 — CHILL zone. Mayer Multiple below 1.0.
Open the app to see the current Barometer score, the live Mayer Multiple reading, and the complete breakdown of all eight indicators.
NakamotoNotes provides data and education, not financial advice. Bitcoin is volatile; you can lose money. Do your own research.