
NakamotoNotes provides data and education, not financial advice. Bitcoin is volatile; you can lose money. Do your own research.
Track eight Bitcoin on-chain indicators — including the signals discussed below — in the NakamotoNotes app.
Bitcoin bear markets have historically followed a recognizable pattern in on-chain data — before, during, and after major price declines. Understanding that pattern is the foundation of any data-driven approach to navigating them.
This article looks at what on-chain indicators have shown during past Bitcoin bear markets and how the NakamotoNotes Barometer tracks where the market sits in the current cycle.
What Defines a Bitcoin Bear Market
Bitcoin has gone through four major bear markets since 2011. Each was defined by a sustained decline of more than 75% from the prior cycle peak:
- 2011–2012: -94% from peak ($32 → $2)
- 2013–2015: -86% from peak ($1,163 → $160)
- 2017–2018: -84% from peak ($19,783 → $3,130)
- 2021–2022: -77% from peak ($68,789 → $15,500)
Price alone tells only part of the story. On-chain metrics have historically shifted into low-percentile territory before price bottomed — and begun recovering before price did. That lag between on-chain data and price is where a multi-indicator framework adds information.
What On-Chain Data Has Shown During Past Bear Markets
Three indicators tracked by NakamotoNotes stand out as historically significant during bear markets:
MVRV Z-Score measures the ratio of Bitcoin's market capitalization to its realized value, normalized by standard deviation. At the December 2018 cycle low, the MVRV Z-Score fell to approximately -0.12 — below zero, indicating the market capitalization had fallen beneath the aggregate cost basis of all coins on the network. At the June 2022 low, it reached approximately -0.30. Negative MVRV Z-Score readings have historically coincided with the deepest phases of Bitcoin bear markets.
Mayer Multiple (price ÷ 200-day moving average) dropped to approximately 0.51 in December 2018 and to 0.60 in March 2020. These sub-1.0 readings indicate price trading below its longer-term average — a condition that has accompanied every major Bitcoin bear market bottom on record.
NUPL (Net Unrealized Profit/Loss) tracks whether the average Bitcoin holder is in unrealized profit or loss. During the 2018 bear market, NUPL turned negative for the first time since 2015, reaching approximately -0.13 at the cycle low. A negative NUPL reading means the aggregate market is, on average, holding at a loss.
These are descriptive observations about what occurred historically. They describe past states of the market — they do not indicate what will happen in any future period.
How the NakamotoNotes Barometer Measures Market Phases
The Bitcoin Barometer combines eight on-chain and market indicators into a single composite score from 0 to 100, updated daily:
- MVRV Z-Score
- Mayer Multiple
- NUPL
- Fear & Greed Index
- Puell Multiple
- Monthly RSI
- Pi Cycle Top Indicator
- Google Search Trends
Each component contributes equally to the composite score. The score divides into four zones:
- CHILL (0–35): Multiple indicators in low-percentile territory simultaneously — the pattern historically associated with bear market conditions
- WARM (36–55): Mixed signals; recovery or mid-cycle
- HOT (56–74): Multiple indicators elevated; late-cycle patterns
- FIRE (75–100): Historically rare; all indicators in top-percentile territory
The composite approach reduces noise. Any single indicator can produce false signals; combining eight independent data streams smooths that out.
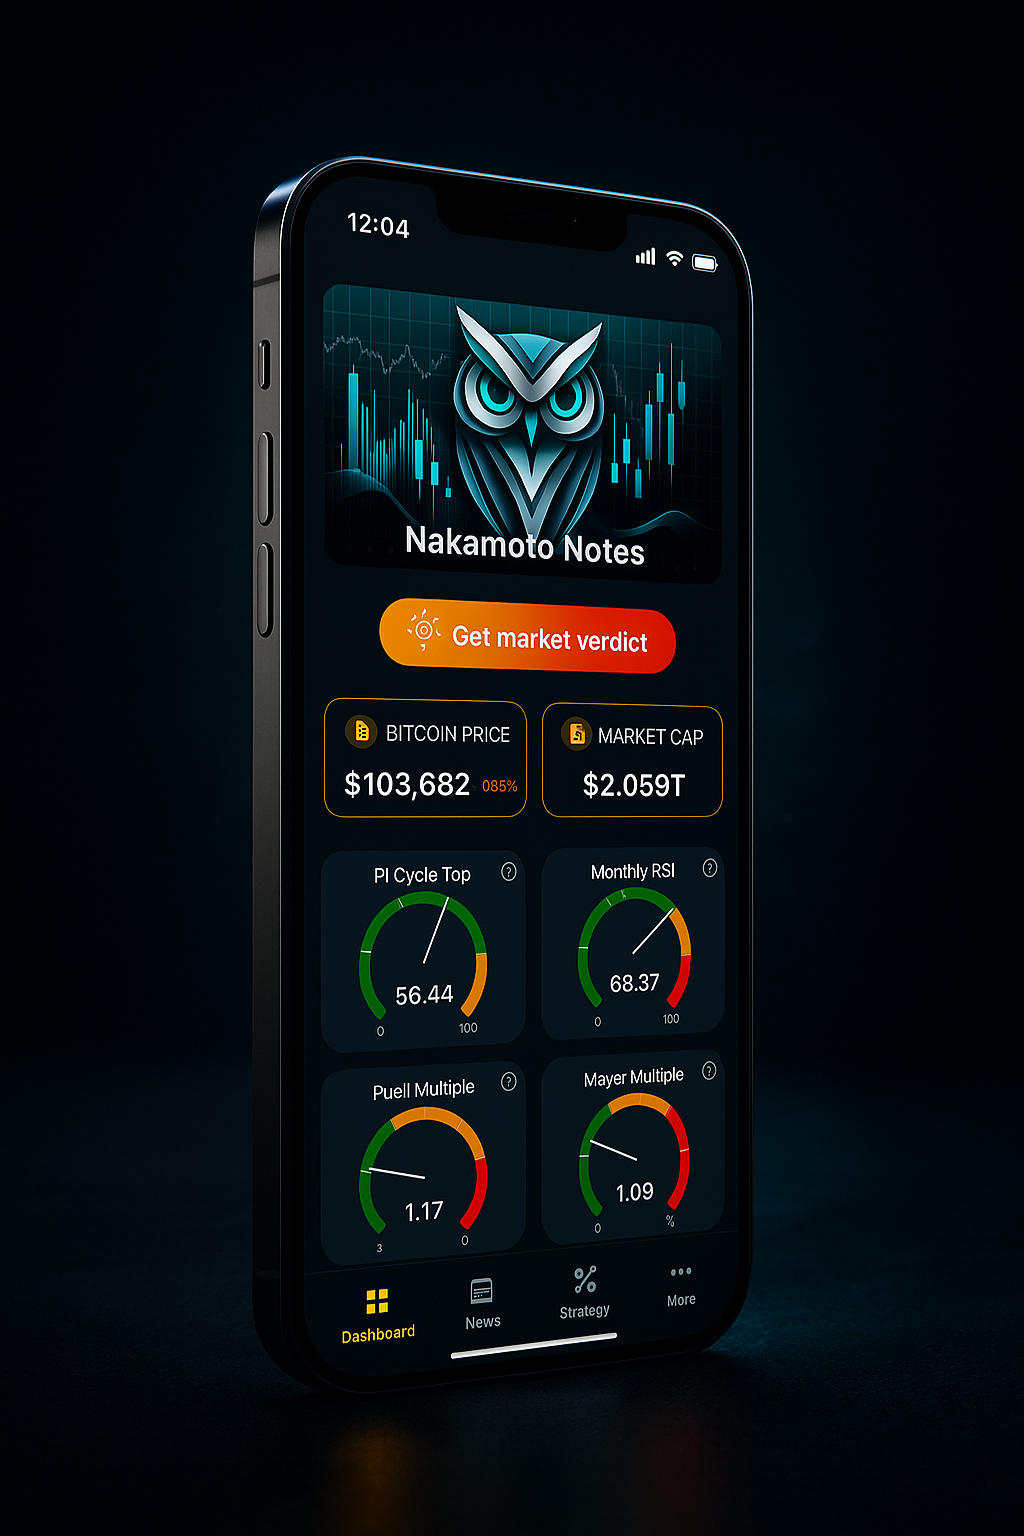
Current reading (May 23, 2026): Bitcoin Barometer at 21/100 — CHILL zone. Bitcoin price: $77,644. All eight indicators are in low-percentile territory consistent with patterns observed during prior bear market phases.
Following Data Instead of Emotion
The consistent theme across every Bitcoin bear market is that sentiment — fear during declines, capitulation near lows — tends to peak well before the data stabilizes. Investors who track data independently of price momentum have historically had earlier visibility into where the cycle stands relative to prior bear markets.
NakamotoNotes provides eight independent data streams as a single daily number — no predictions, no advice, no price targets. The Barometer tells you where the data stands today and what history has shown at comparable readings. What you do with that information is your decision.
Open the app to see today's Barometer score and the full component breakdown.
NakamotoNotes provides data and education, not financial advice. Bitcoin is volatile; you can lose money. Do your own research.