
NakamotoNotes provides data and education, not financial advice. Bitcoin is volatile; you can lose money. Do your own research.
Track the MVRV Z-Score and seven other on-chain indicators — consolidated into one daily Barometer score — in the NakamotoNotes app.
The MVRV Z-Score is one of the most reliable on-chain indicators for identifying Bitcoin market cycle extremes. It's used by professional traders, on-chain analysts, and long-term investors to answer a simple but powerful question: is Bitcoin currently cheap or expensive relative to its historical cost basis?
This guide explains exactly what the MVRV Z-Score measures, how to interpret it, and how it fits into a complete on-chain analysis framework for Bitcoin investors.
What Is the MVRV Z-Score?
The MVRV Z-Score is built from two components:
- Market Value (MV) — Bitcoin's total market capitalization: current price × circulating supply. This is what the market values Bitcoin at right now.
- Realized Value (RV) — The total value of all Bitcoin at the price each coin last moved on-chain. Instead of using the current price for every coin, it uses the actual price each holder paid (or received when last transacting). This represents the aggregate cost basis of the entire network.
The ratio of these two — Market Value ÷ Realized Value — is called MVRV. When MVRV is high, the market is collectively sitting on large unrealized gains relative to what everyone paid. When it's low or negative, the market is near breakeven or below cost.
The Z-Score normalizes this ratio by its historical standard deviation, expressing where the current MVRV sits relative to its own history. This produces a standardized reading that makes cross-cycle comparison meaningful.
How to Read the MVRV Z-Score
Interpreting the MVRV Z-Score follows a consistent pattern across all of Bitcoin's market cycles:
| Z-Score Range | Market Condition | Historical Significance |
|---|---|---|
| Above 7 | Extreme overvaluation | Has marked cycle peaks in every major bull market (2013, 2017, 2021) |
| 3 to 7 | Elevated, bull market territory | Sustained euphoria phase; meaningful unrealized gains across network |
| 0 to 3 | Neutral to moderately positive | Fair value range; typical for early bull or late bear transitions |
| Below 0 | Undervaluation / capitulation | Average holder is underwater; has historically been a strong long-term accumulation zone |
The Z-Score rarely stays below 0 for extended periods. When it does, it historically represents a period of significant undervaluation — the market has sold off below the network's aggregate cost basis. These moments have preceded recoveries in every previous cycle.
MVRV Z-Score vs. Simple MVRV Ratio
You'll see both "MVRV" and "MVRV Z-Score" discussed in on-chain analysis. The difference matters:
- MVRV Ratio: Simply Market Value ÷ Realized Value. Straightforward but harder to compare across cycles because Bitcoin's market dynamics have changed significantly since 2013.
- MVRV Z-Score: Normalizes the ratio by subtracting the mean and dividing by standard deviation. This makes high readings in 2021 comparable to high readings in 2017 or 2013 — accounting for the different scale of the market at each cycle.
For most investors, the Z-Score is the more useful version because it tells you not just whether MVRV is high or low, but how extreme the reading is relative to historical norms.
What the MVRV Z-Score Shows About Bitcoin Cycles
One of the most striking features of the MVRV Z-Score is its consistency across all of Bitcoin's market cycles. Despite Bitcoin growing from thousands of users to millions, and from hundreds of dollars to tens of thousands, the Z-Score has reliably identified cycle extremes at comparable levels:
2013 Peak
MVRV Z-Score reached above 9 during the December 2013 peak. The subsequent correction dropped Bitcoin 84% over the following year. During the 2015 capitulation, Z-Score briefly went negative.
2017–18 Cycle
Z-Score peaked above 9 in December 2017. The 2018 bear market took Bitcoin down 84% to around $3,200. At the December 2018 bottom, Z-Score again approached 0 and briefly went negative.
2021 Cycle
Z-Score reached approximately 8 during the April 2021 peak and again near 7 in November 2021. The subsequent correction took Bitcoin from $69,000 to $16,000 by late 2022. During the 2022 bear market, Z-Score went negative — marking one of the strongest buying signals in Bitcoin's history.
The pattern is consistent: extreme Z-Score readings (above 7) have preceded major corrections; negative or near-zero readings have preceded recoveries. No indicator is perfect, but the MVRV Z-Score has the most consistent cross-cycle track record of any on-chain metric.
Limitations of the MVRV Z-Score
Like any single metric, MVRV Z-Score has limitations that investors should understand:
- Lagging at extremes: The Z-Score can stay elevated for months during a bull market. Using it as a timing signal in isolation can result in exiting positions too early during the euphoria phase.
- Exchange coins distortion: Large amounts of Bitcoin sitting on exchanges (especially before institutional custody became standard) can affect the realized value calculation in ways that don't perfectly reflect true cost basis.
- Doesn't work for short-term trading: The Z-Score is a macro cycle indicator, not a weekly trading signal. It identifies cycle phases over months and years, not days or hours.
- Each cycle is different in detail: While the pattern is consistent, the exact Z-Score levels at peaks and troughs vary. The 2021 peak was lower (around 8) than the 2017 peak (above 9), likely reflecting the maturing market.
For these reasons, the MVRV Z-Score is most powerful when used alongside other on-chain indicators rather than in isolation.
MVRV Z-Score as Part of a Complete Framework
The strongest on-chain analysis frameworks combine multiple indicators to cross-validate readings. The MVRV Z-Score is one of the three core metrics in the Bitcoin Barometer — alongside the Mayer Multiple and NUPL (Net Unrealized Profit/Loss).
Each metric captures a different dimension of the same underlying dynamic:
- Mayer Multiple — price vs. long-term trend (200-day moving average). Simple, price-based.
- MVRV Z-Score — market cap vs. realized cost basis, normalized. On-chain.
- NUPL — percentage of the supply that is currently in profit. Sentiment-revealing.
When all three agree (all low in bear market, all high in bull market), the signal is strong. When they diverge, it often indicates a transitional phase worth monitoring closely.
What the Current MVRV Z-Score Indicates
The current Bitcoin Barometer score is 21 out of 100 — in the CHILL zone. This reflects a MVRV Z-Score near neutral, with Market Value close to Realized Value.
What this means practically:
- The average Bitcoin holder is near breakeven — not deeply in profit (which would signal overvaluation) and not deeply in loss (capitulation)
- The market is not showing the extreme unrealized gain concentration that has historically preceded major corrections
- From a historical perspective, entering a long-term position when MVRV Z-Score is near neutral has consistently produced favorable outcomes over 4+ year horizons
How to Track the MVRV Z-Score
The MVRV Z-Score is calculated from raw on-chain blockchain data — specifically the UTXOs (unspent transaction outputs) and their associated last-moved prices. This data is publicly available on-chain but requires significant infrastructure to process and normalize.
Several platforms publish MVRV Z-Score data. The Bitcoin Barometer tracks it alongside NUPL and the Mayer Multiple, combining all three into a single daily score so you don't need to check three separate charts before making a decision.
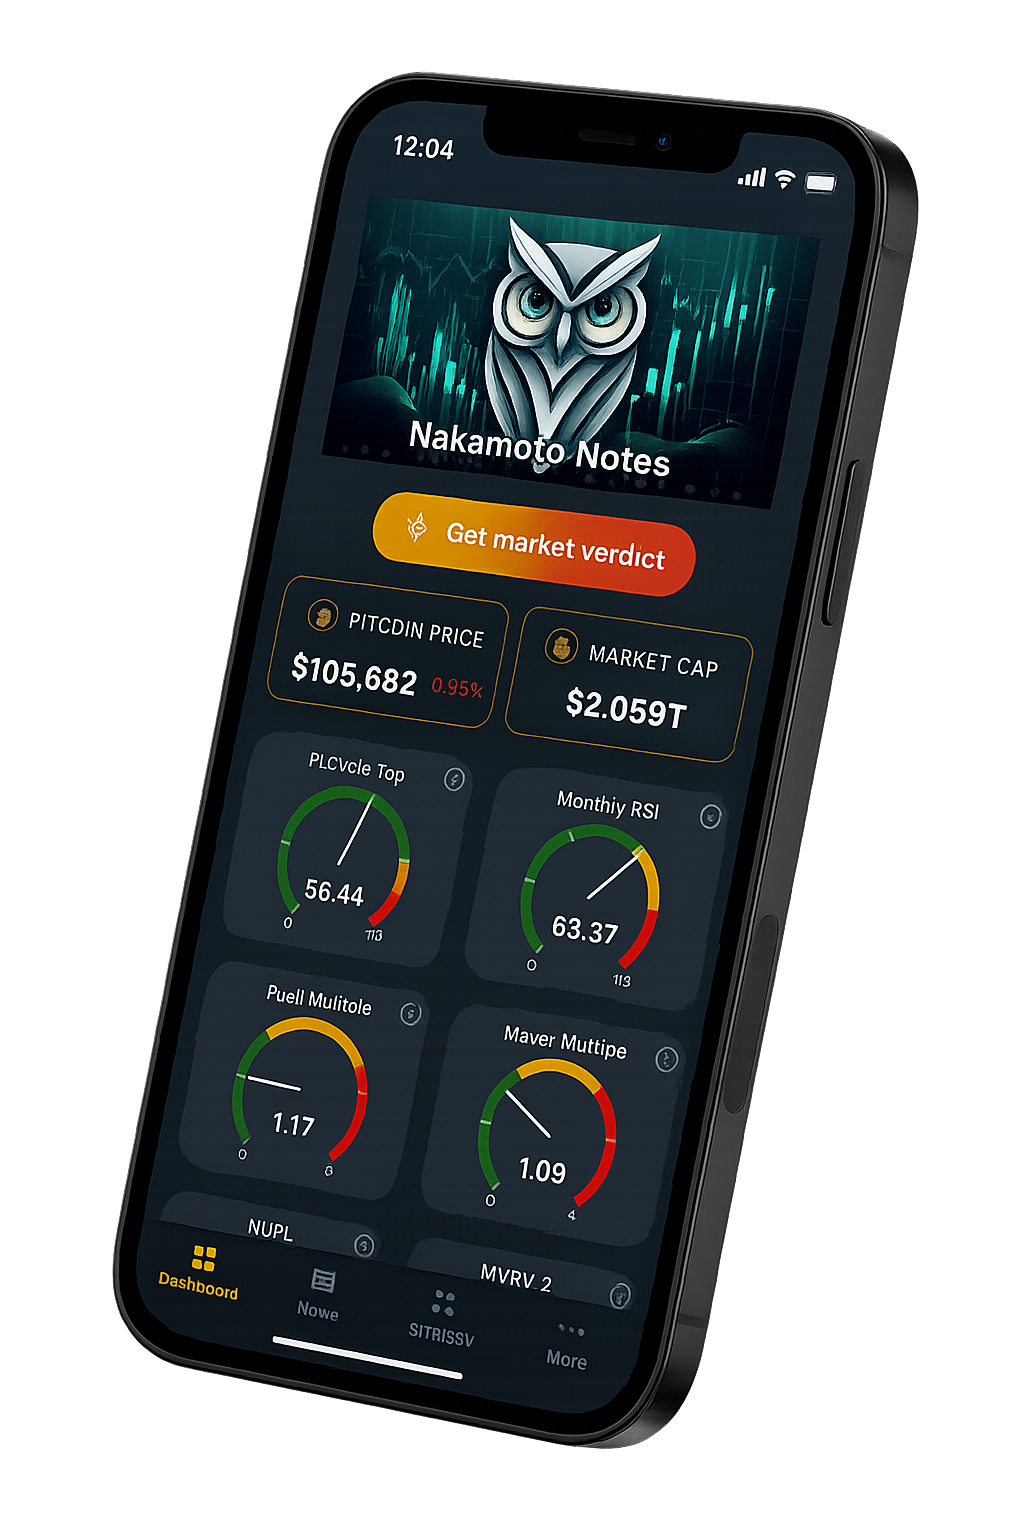
The NakamotoNotes app — MVRV Z-Score, Mayer Multiple, and NUPL consolidated into one daily Barometer score.
Track MVRV Z-Score With the Bitcoin Barometer
The NakamotoNotes app calculates the Barometer daily — combining MVRV Z-Score, Mayer Multiple, and NUPL into one score. Get alerts when the indicators move into key accumulation or caution zones.